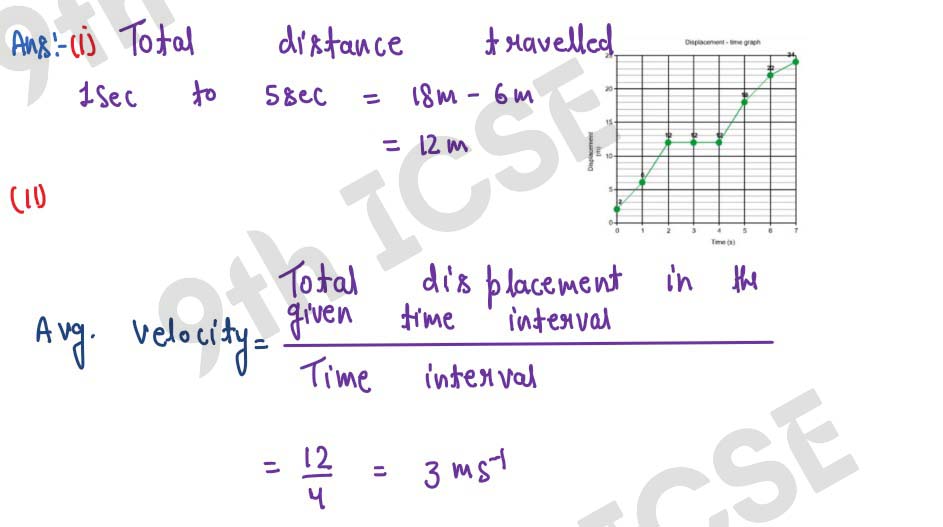
Q3 A body is moving in a straight line and its displacement at various instants of time is given in the following table:
        time(s) :         0   1   2    3    4    5    6    7
    displacement(m) : 2   6   12   12   12   18   22   24

    Plot displacement-time graph and calculate:
    (i) Total distance travelled in interval 1s to 5s,
    (ii) Average velocity in time interval 1s to 5s.
Solution